Overview Dashboard
Campaign Engagements – This chart displays the Campaign Engagement Metrics by Campaign Months.
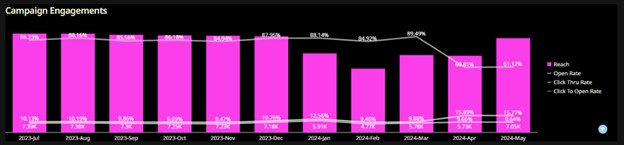
- Reach – The number of emails reached, calculated as recipients minus bounces.
- Open Rate – The percentage of reached emails that opened the campaigns, calculated as unique opens divided by reach.
- Click Through Rate – The percentage of reached emails that clicked through the campaigns, calculated as unique clicks divided by reach.
- Click to Open Rate – The ratio of unique clicks to unique opens, calculated as unique clicks divided by unique opens, then multiplied by 100.
Streaks Section
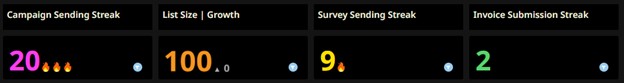
- Campaign Sending Streak – This value shows the number of consecutive campaigns sent.
- List Size | Growth – This value shows the current list size and the growth (change) from the previous month’s list size.
- Survey Sending Streak – This value shows the number of consecutive campaigns sent that included a survey.
- Invoice Submission Streak – This value shows the number of consecutive months with a submitted invoice. Only months in which the partner is booked into a program are included.
Other Gauges
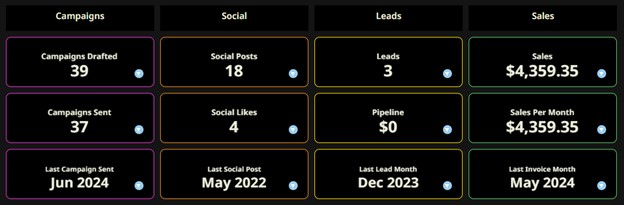
- Campaigns Drafted – Displays the number of campaigns drafted for the partner.
- Campaigns Sent – Displays the number of campaigns sent by the partner.
- Last Campaign Sent – Displays the month and year of the latest sent campaign.
- Social Posts – Displays the total count of posts.
- Social Likes – Displays the total count of likes.
- Last Social Post – Displays the month and year of the latest campaign posted.
- Leads – Displays the total count of leads which is composed of BANT & Online Inquiries.
- Pipeline – Displays the total amount of pipeline (or Budget) filled out by the survey respondents.
- Last Lead Month – Displays the month and year the latest lead was generated.
- Sales – Displays the total amount of sales.
- Sales Per Month – Displays the average amount of sales per month.
- Last Invoice Month – Displays the month and year of the latest invoice date.
Campaigns Dashboard
Subscriber Activities Chart – This chart displays the distribution of the different subscriber interactions and engagements such as Reach, Open, Click and Bounce.
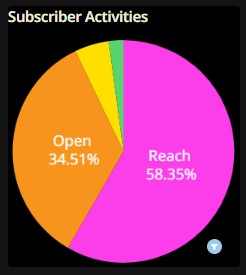
Where:
- Reach – Percentage of subscribers who received the emails successfully.
- Open – Percentage of subscribers who opened the email campaigns.
- Click – Percenatage of subscribers who clicked thru the campaigns.
- Bounce – Percentage of subscribers who did not receive the emails.
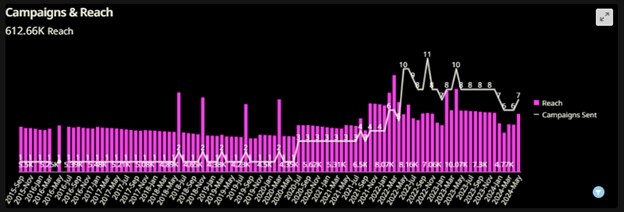
Campaigns & Reach – This chart displays the number of Campaigns Sent and the number of Reach by Campaign Months.
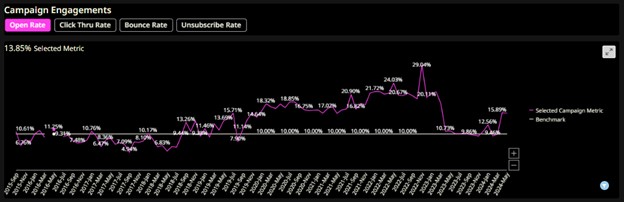
Campaign Engagements – This chart displays the rest of the Campaign Engagements against the respective benchmarks by Campaign Months. Specific engagements such as Open Rate, Click Thru Rate, Bounce Rate, and Unsubscribe Rate can be selected individually located on top of the Chart.
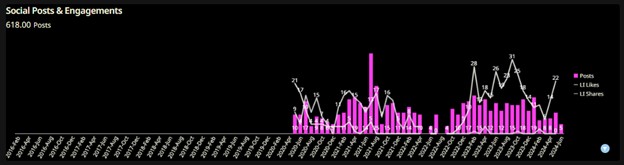
Social Posts & Engagements – This chart displays the number of Posts and the Engagements by Campaign Months.
Content Dashboard
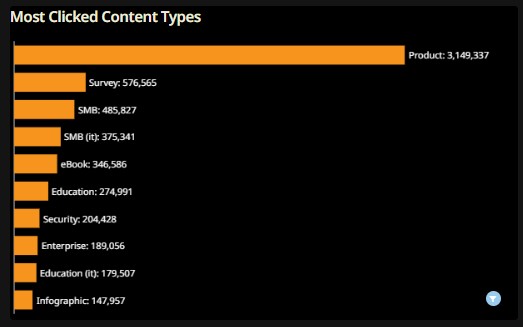
Most Clicked Content Types – This chart displays the Top 10 most clicked Content Types.
Most Clicked Content Pieces – This chart displays the Top 10 most clicked Content Pieces (or Titles).

Most Viewed Social Posts – This chart shows the Top 10 Campaigns Posted in Socials that generated the most views.

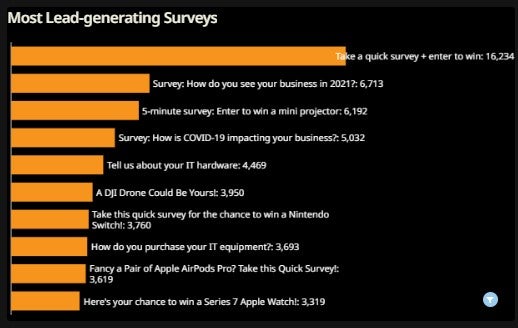
Most Lead-generating Surveys – This chart shows the Surveys that generated the most leads.
Subscribers Dashboard
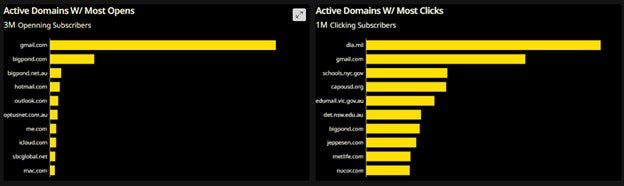
Top 10 Engaging Subscribers Section – This section provides the Top 10 most engaged email domains. The engagement is segmented by Most Opens and Most Clicks.
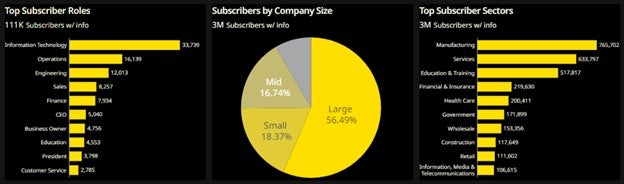
Subscriber Firmographics – This section provides the distribution of the Subscribers by Roles, Company Size and Sectors, where available.
Subscriber Domains Report – This visualization shows several interesting metrics by email domain in a tabular format.
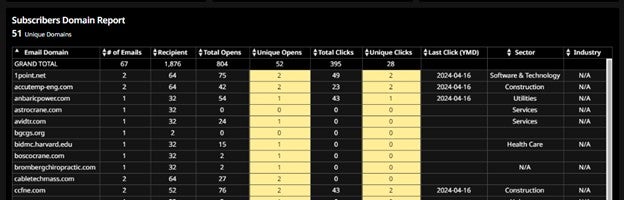
- # of Emails – Displays the number of unique campaigns received by the same email domain.
- Recipient – Displays the number of people who were sent campaigns.
- Total Opens – Displays the total number of times the emails are opened.
- Unique Opens – Displays the unique number of people who opened the emails.
- Total Clicks – Displays the total number of times the campaigns are clicked-thru.
- Unique Clicks – Displays the unique number of people who clicked-thru the campaigns.
- Last Click (YMD) – Displays the latest click date.
- Sector – Displays the email domain’s sector.
- Industry – Displays the email domain’s industry.
Sales Dashboard
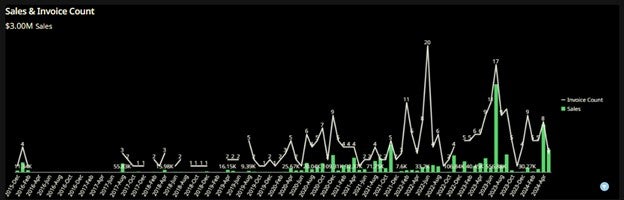
Sales & Invoice Count – This chart displays the amount of Sales and Number of Invoices Submitted by Invoice Months
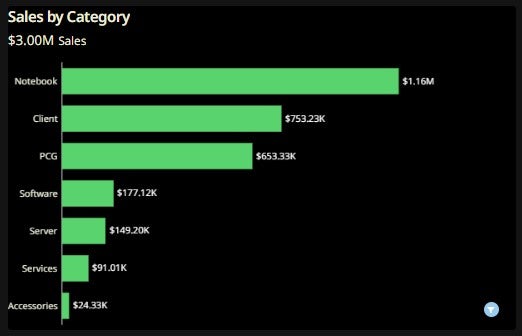
Sales by Category – This chart displays the amount of Sales by Product Category
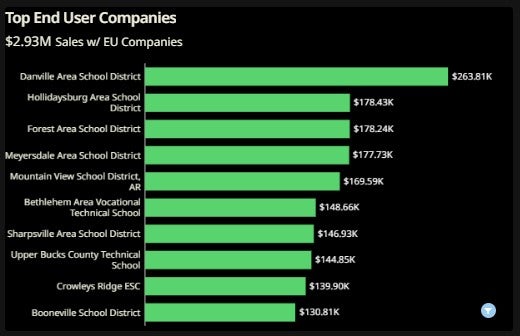
Top End User Companies – This chart displays the Top 10 buyers, showing the company names (where available) and corresponding sales amount
Last updated June 2024
