Program Filters
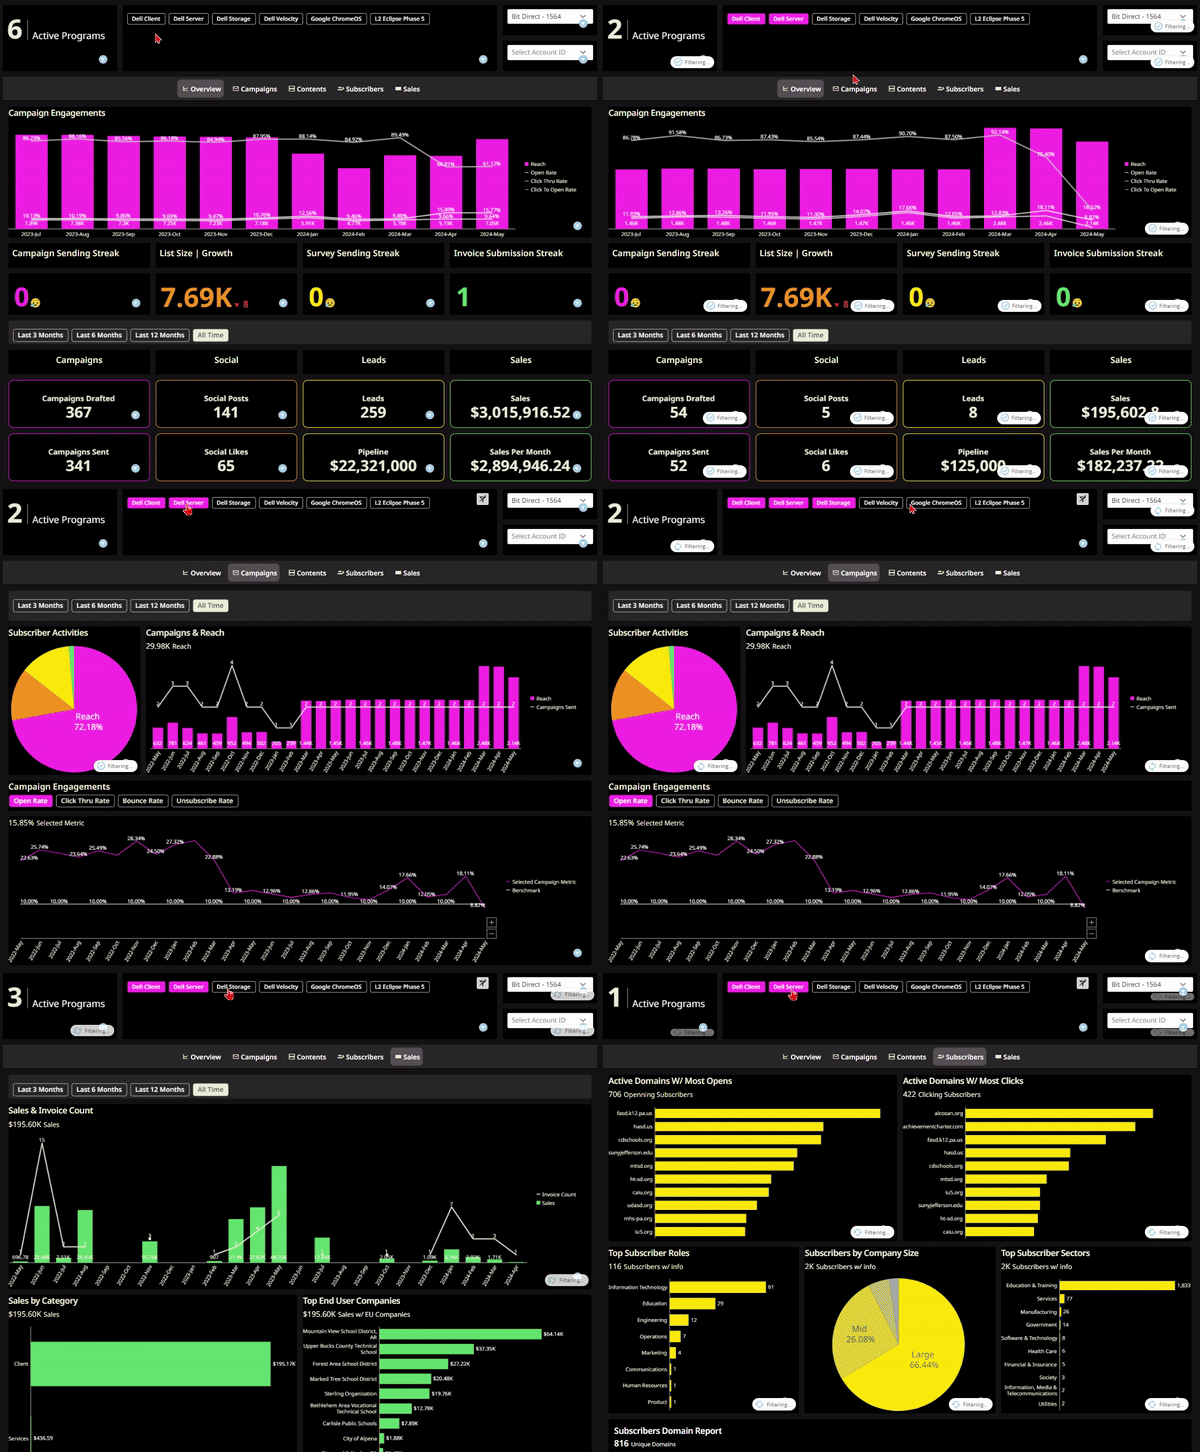
Program Filters are located at the top of Performance Tracking and displays the specific programs you run campaigns for. Once a program is selected all data in Performance Tracking is filtered and the data stays filtered even when switching between dashboards.
Time Based Filters
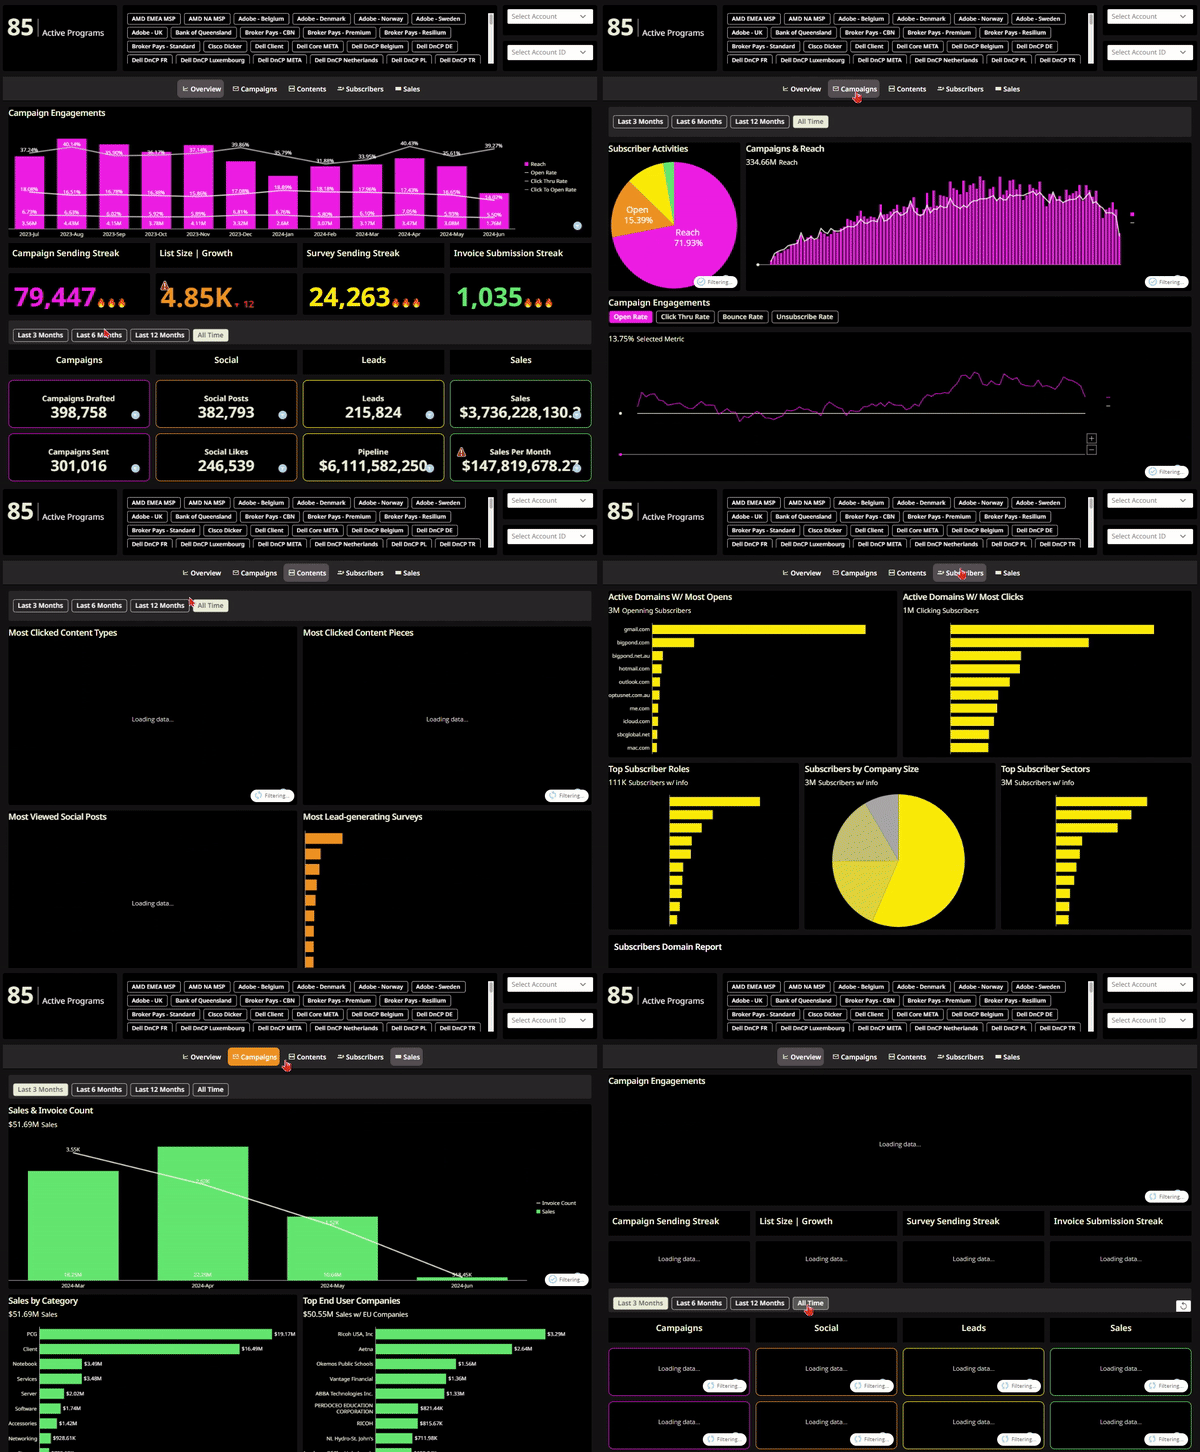
Beneath each of the dashboards you will notice a period range filter. Performance tracking offers four period range options, allowing users to easily filter the data displayed on the dashboard.
Unlike the Program Filter, each tab has its own independent period filter that must be selected separately.
The Period Filter does not affect certain elements, such as the gauges in the Streaks Section and the entire Subscribers section, as it is not applicable to them.
Cross Chart Filters
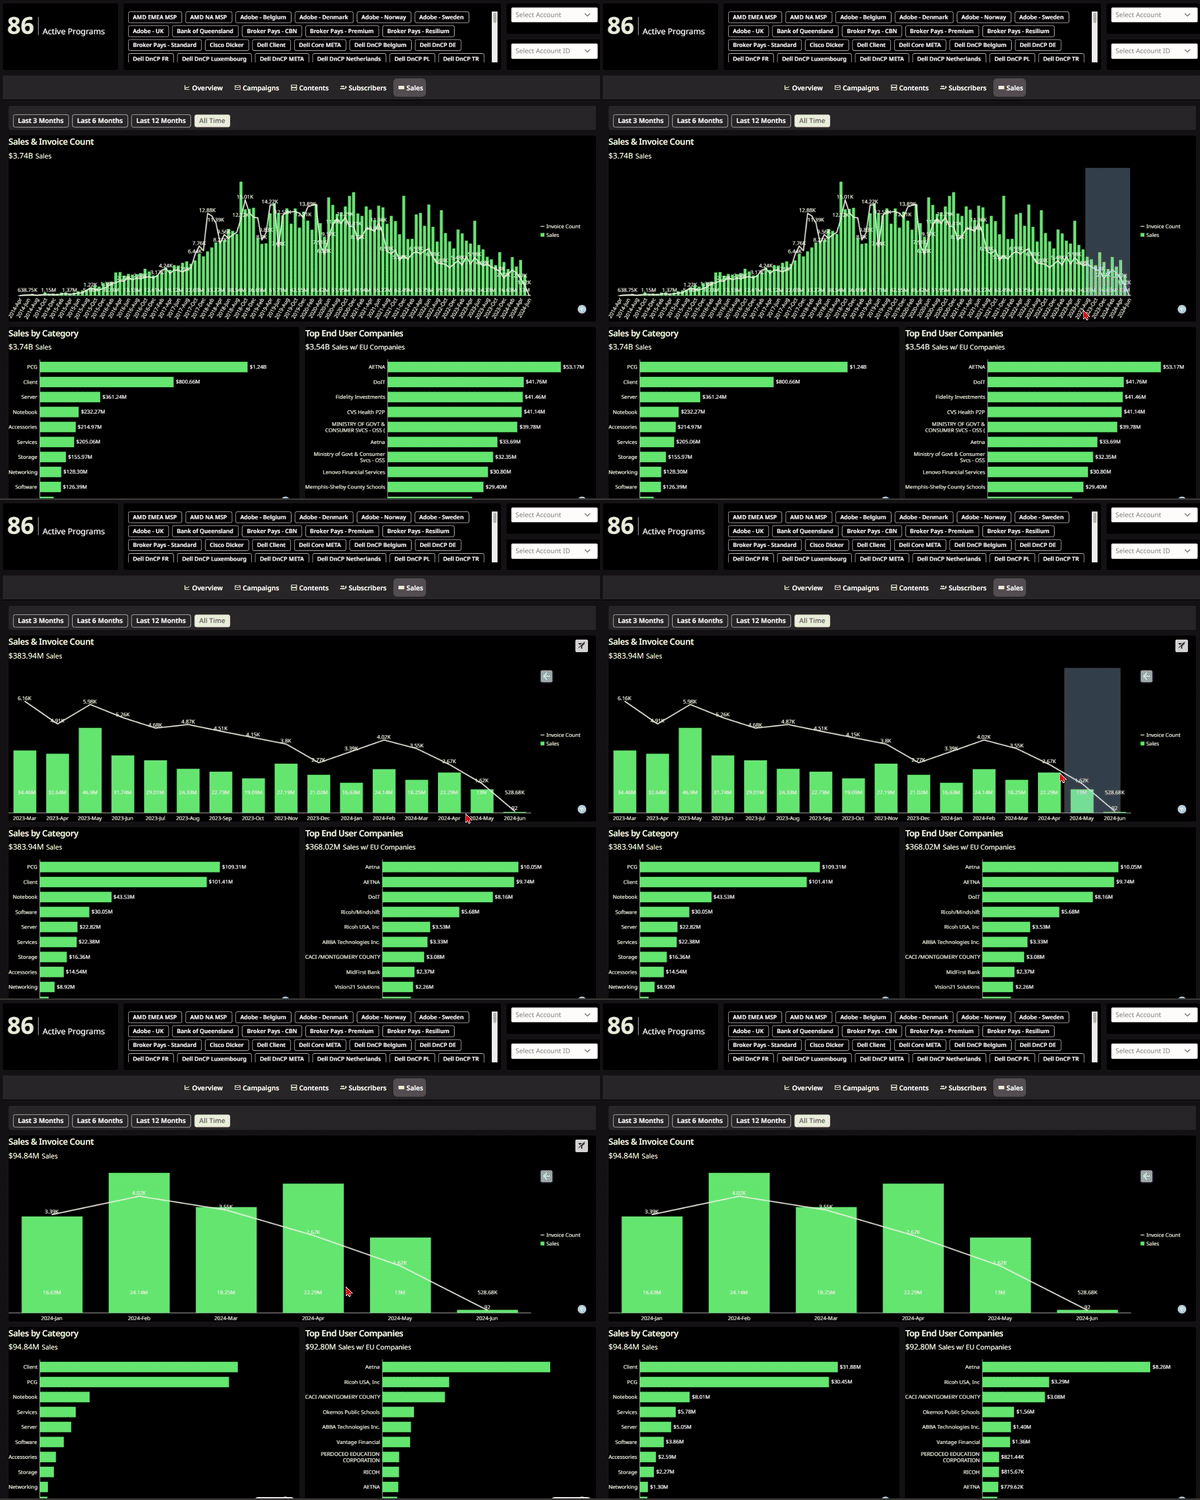
Cross-Chart Filtering allows users to click or select a specific element within a chart, dynamically updating the rest of the charts to display data corresponding to the selected element. Two types of interactions are shown below – Single and Drag Selection.
What is “Single Selection”?
Single Selection allows users to select or click on the elements in the chart, such as column bars, individually, then updating the rest of the charts within the same tab to display the data corresponding to the selected months.
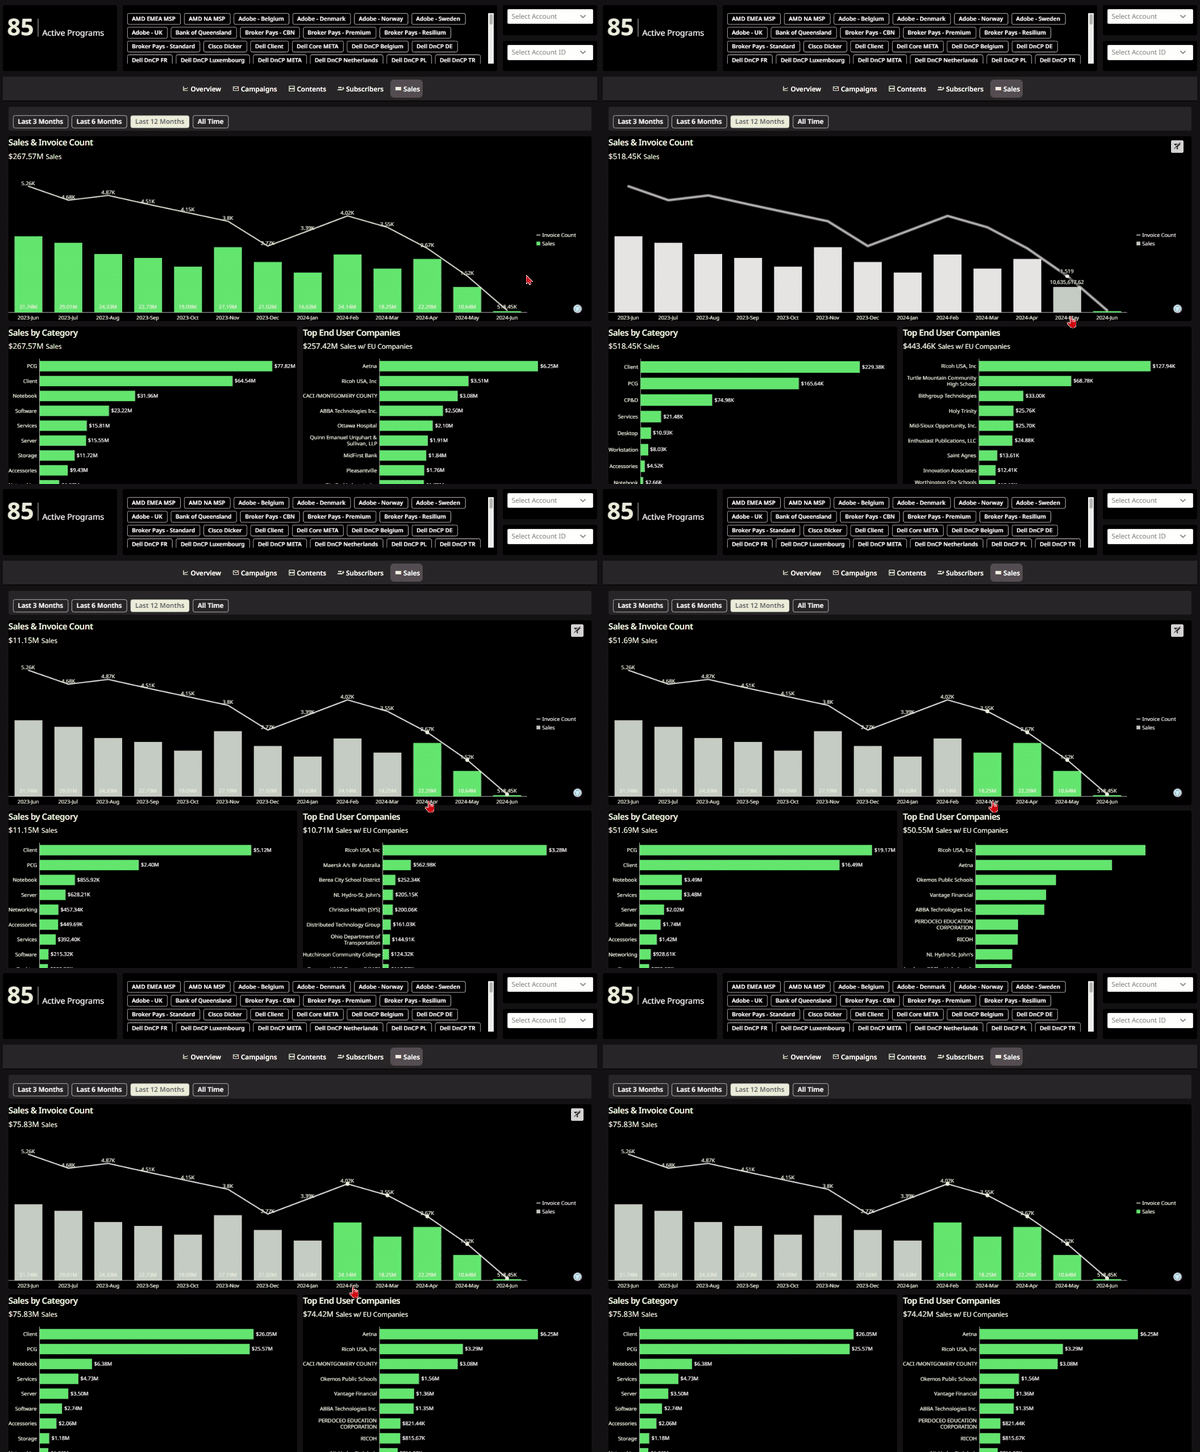
This highlights the versatility of Cross-Chart Filtering, enabling users to not only filter by months but also select categories and track their performance over time. This functionality is particularly useful with time series charts, where data updates in real-time as categories are selected.
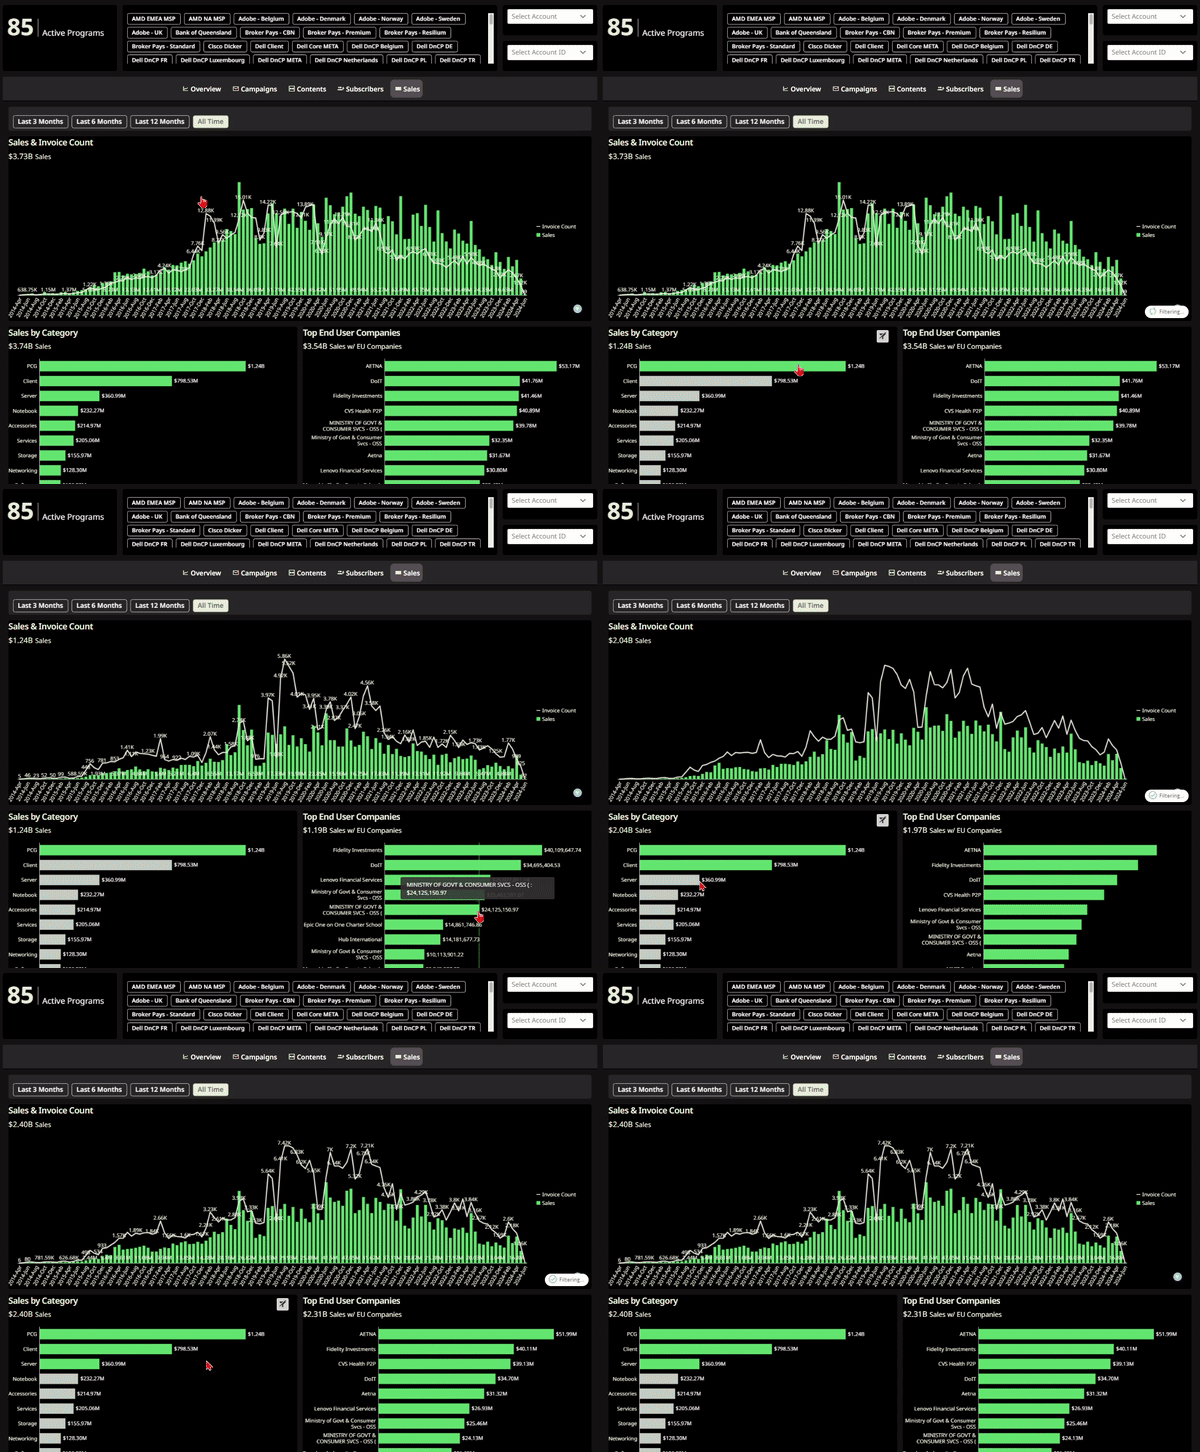
What is “Drag Selection”?
Users can perform a Drag Selection by left-clicking and holding on the column bars they wish to filter and display. Simply drag the cursor from one end to the other to select the desired bars.
How to remove “Cross-Chart” Filters?
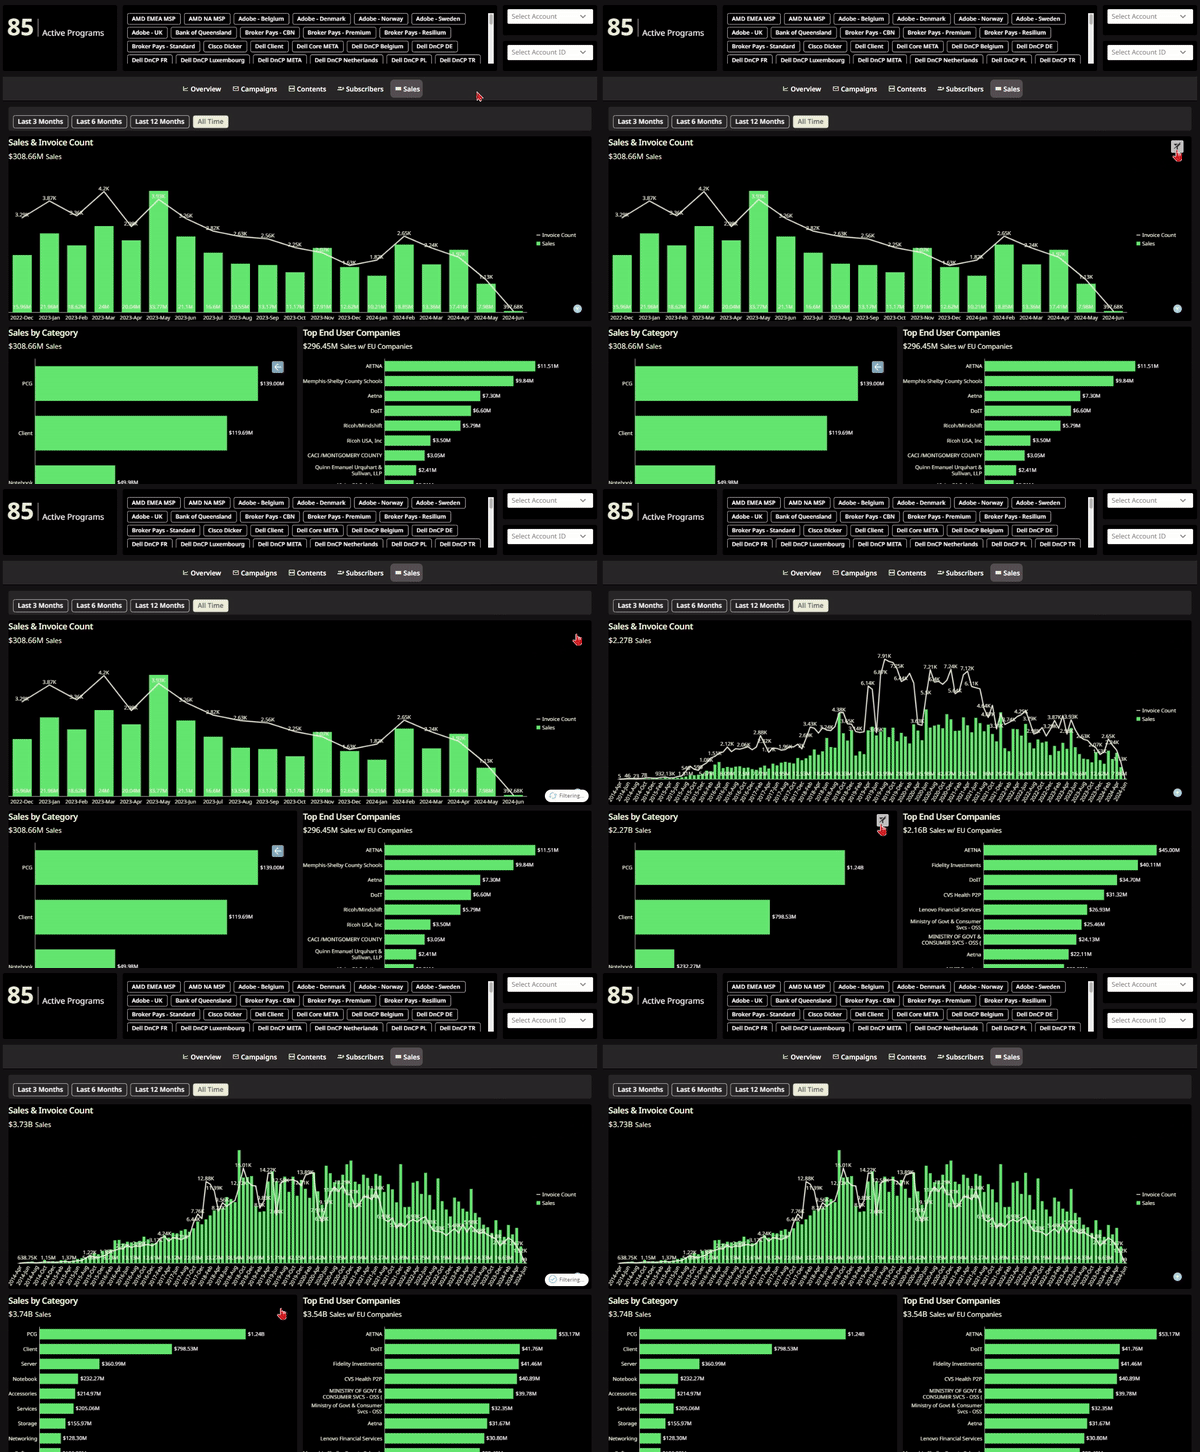
To remove Cross-Chart Filters, just click on the funnel icon on the top right corner of the charts used to filter the whole dashboard tab.
Variables
Variables are scattered throughout the dashboards and used to pick a certain KPI that will be displayed in a single visualization. Here is an example below that displays different engagement metrics against the industry benchmark.

Ultimo aggiornamento Giugno 2024


